COVID-19: German Mobility Monitoring 2020
Peter Barkow, Till Krueger, Dr. Wolfgang Schnorr |
For Free Updates Sign Up to Our Newsletters >> HERE
A Tale of Two Lockdowns
German Mobility: Lockdown 1 vs. Lockdown 2
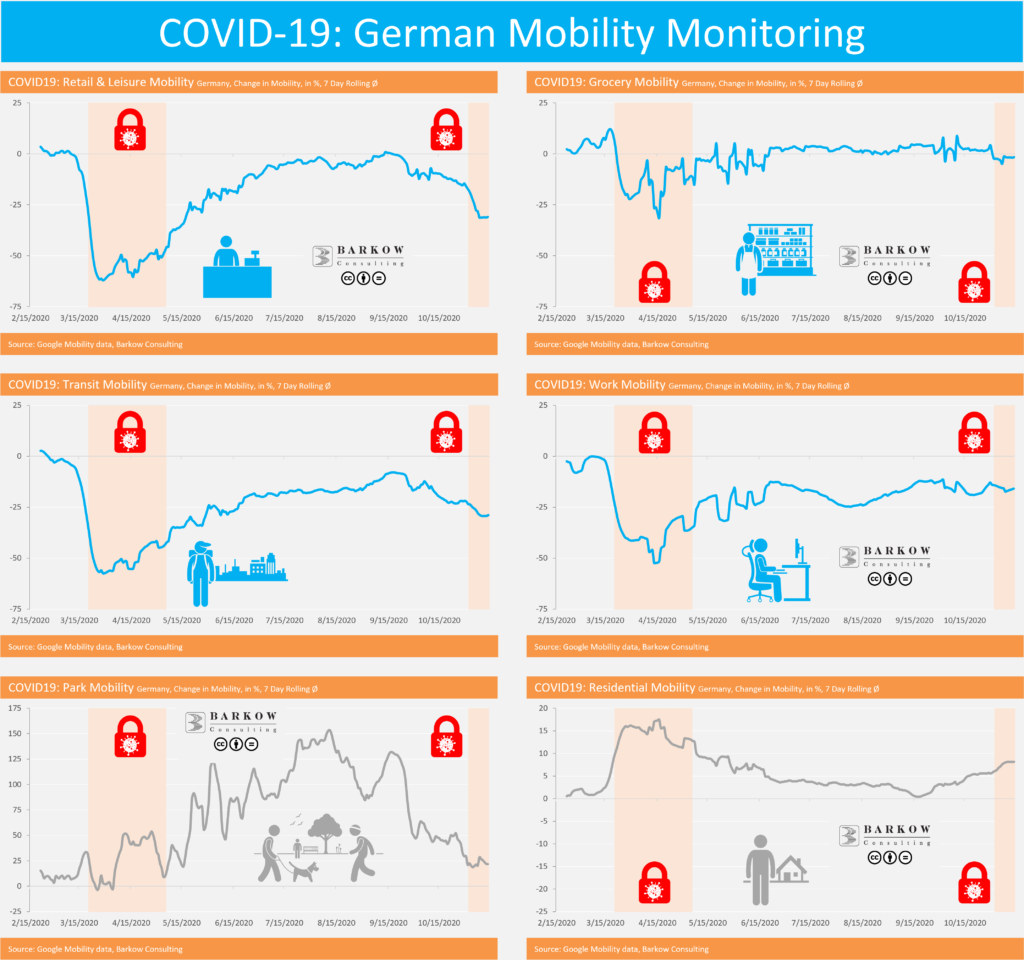
Below we show the development of mobility in Germany as measured by Google in six different categories throughout 2020. Google mobility data shows the difference to „normal“ defined as the median for each weekday from 3 January to 6 February 2020. We admit that this is a pretty short period for a statistical baseline, but this is the best we can get. In addition, we understand the data being neither seasonally nor calendar adjusted, which can explain certain big swings you find in them. In order to mitigate this distortion, we calculated 7 day rolling averages smoothing peaks and troughs. Therefore, underlying trends show up more clearly.
Below mobility charts include data until 15 November 2020 covering the first two weeks of the 2nd German (light) lockdown. With this, we intend to provide an initial indication as to where we currently stand and where things might be heading in terms of mobility and (maybe…) economic activity.
The Big Picture: Q4 Mobility Higher Than Q2, But Lower Than Q3
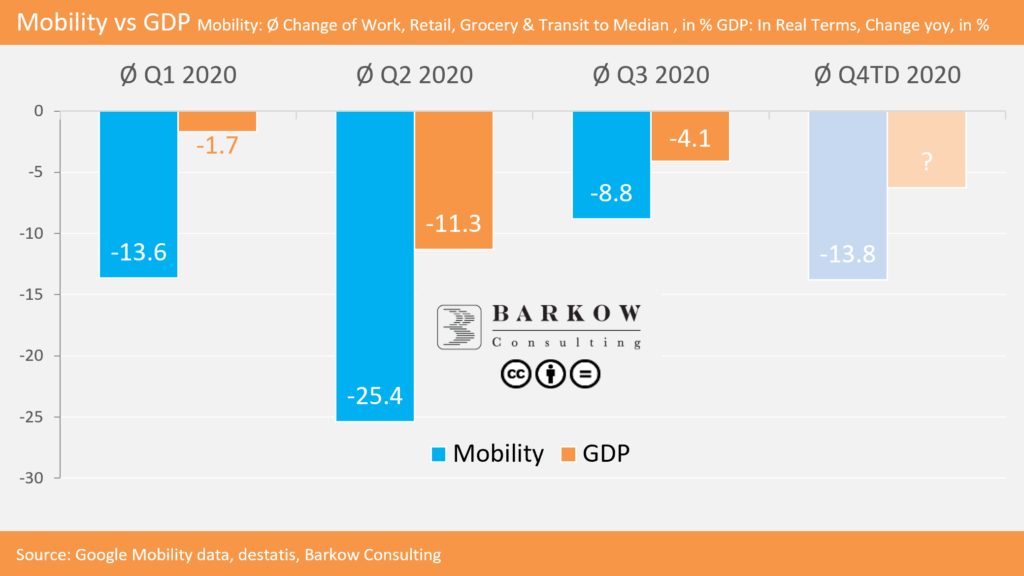
Below chart shows the unweighted average of mobility changes in Work, Retail, Grocery & Transit per quarter. These are the categories actually being negatively impacted by a lockdown. On the other hand, mobility in Parks and Homes tends to increase during a lockdown. The chart also includes the year over year development of GDP.
Based on mobility data, our best guess is, that yoy change of GDP in Q4 could be somewhere between Q2 and Q3; probably closer to Q3 than to Q2.
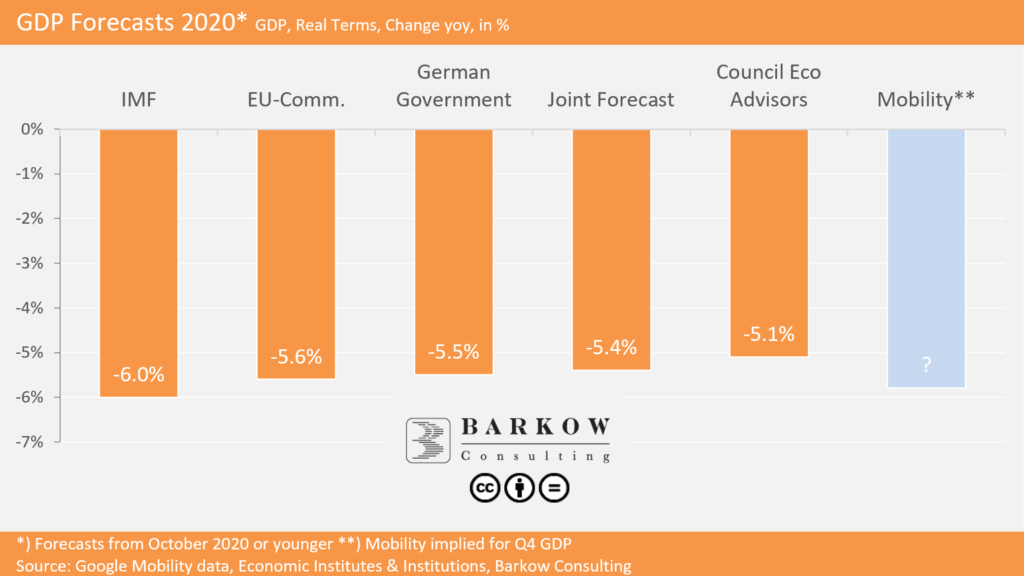
We struggle to get more specific regarding a GDP forecast based solely on mobility data (also see next paragraph). Nonetheless, we give an overview of most recent conventional GDP forecasts for Germany from leading institutions below.
Many Caveats: Broken Models, Untested Correlations, Government Bandaids etc.
As we have said above we would caution to read too much into mobility data in terms of economic forecasting. In our experience many forecast models are still struggling with the impact of the COVID-19 crisis as long learned correlations have dramatically changed or completely collapsed. So far there is no blueprint available that we can rely on.
As one of many examples we would like to hint to IMF’s recent cricticism on inflation measurement: Data Disruption: The Impact of COVID-19 on Inflation Measurement
Of course we appreciate the flood of new, alternative or high frequency data helping us steer through the ongoing crisis. However, incorporating them into solid forecast models suffers from the same challenges: Unknown or broken correlations.
These major difficulties are underlined also by the Weekly Activity Index (WAI) of Deutsche Bundesbank, which combines nine high frequency data sets in order to estimate economic activity. The WAI is intentionally labelled as „Work in Progress“ and we tend to agree: During COVID19 the WAI was apparently only indicating directional information. The same pattern was by the way true during the former financial crisis 2008/09.
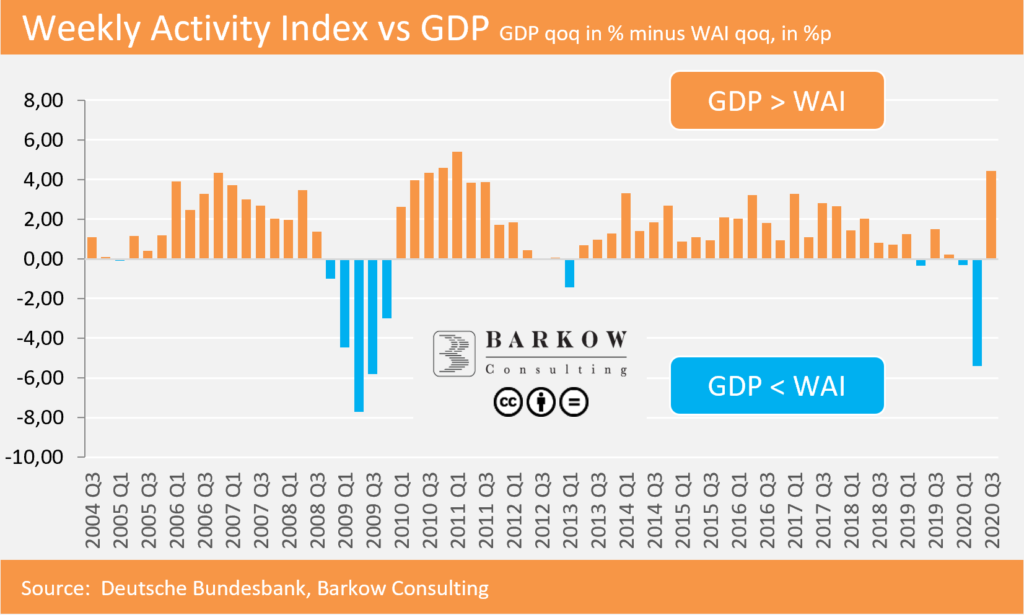
Another wild card regarding Q4 GDP is the substantial impact of governmental support during lockdown 2. E.g., the government has promised to compensate 70% of the revenue loss for many affected smaller businesses, which per se will bump up Q4 GDP accordingly.
Individual Category Results: Lockdown 1 vs. Lockdown 2
Retail & Leisure Mobility – No More Leisure Time
Retail & Leisure Mobility (retail shops for non daily essentials, but also including gymns, cinemas among others) is currently down 31% vs down 62% at the peak of the first lockdown. Unsurprisingly, this is the most impacted category due to almost complete shutdowns of restaurants, gymns, cinemas etc.
Grocery Mobility – Toilet Paper Saturation
Grocery Mobility (daily shopping) is currently down 2% vs down 31% at the peak of the first lockdown. In essence, this means that grocery shopping is actually hardly impacted.
Transit Mobility – Should I Stay or Should I Go?
Transit Mobility is currently down 29% vs down 57% at the peak of the first lockdown, probably largely a function of more people commuting to office compared to lockdown 1.
Work Mobility – See You Around Boss…
Work Mobility is currently down 16% vs down 52% at the peak of the first lockdown. This is, however, roughly in line with the average after the end of the first lockdown, but then again we had holidays during that period and data is not adjusted for that.
Park Mobility – COVID-19 Just a Walk in the Park?
Mobility in Parks is currently up 22% vs up 54% at the peak of the first lockdown in spring. Mobility is, however, much lower than during summer months. Current seasonal weather conditions are likely not motivating too many people to a walk in the park.
Residential Mobility – Home Sweet Home
Residential Mobility is currently up a meagre 8% vs up 17% at the peak of the first lockdown, probably reflecting more people still working in offices and less at home.